
Photo Credit: Rob Robinson
EVICTIONS IN NEW YORK CITY
PROJECT a series of maps examining New York City’s eviction crisis through a historical lens, mapping longstanding discriminatory policies and how their afterlives continue to shape the urban landscape today.
COLLABORATORS Anti-Eviction Mapping Project; Right to Counsel Coalition NYC
LOCATION New York City, NY
LINK TO FULL SITE NYC Evictions Atlas
ADVISOR Eric Brelsford | Advanced GIS, The New School
INTRODUCTION
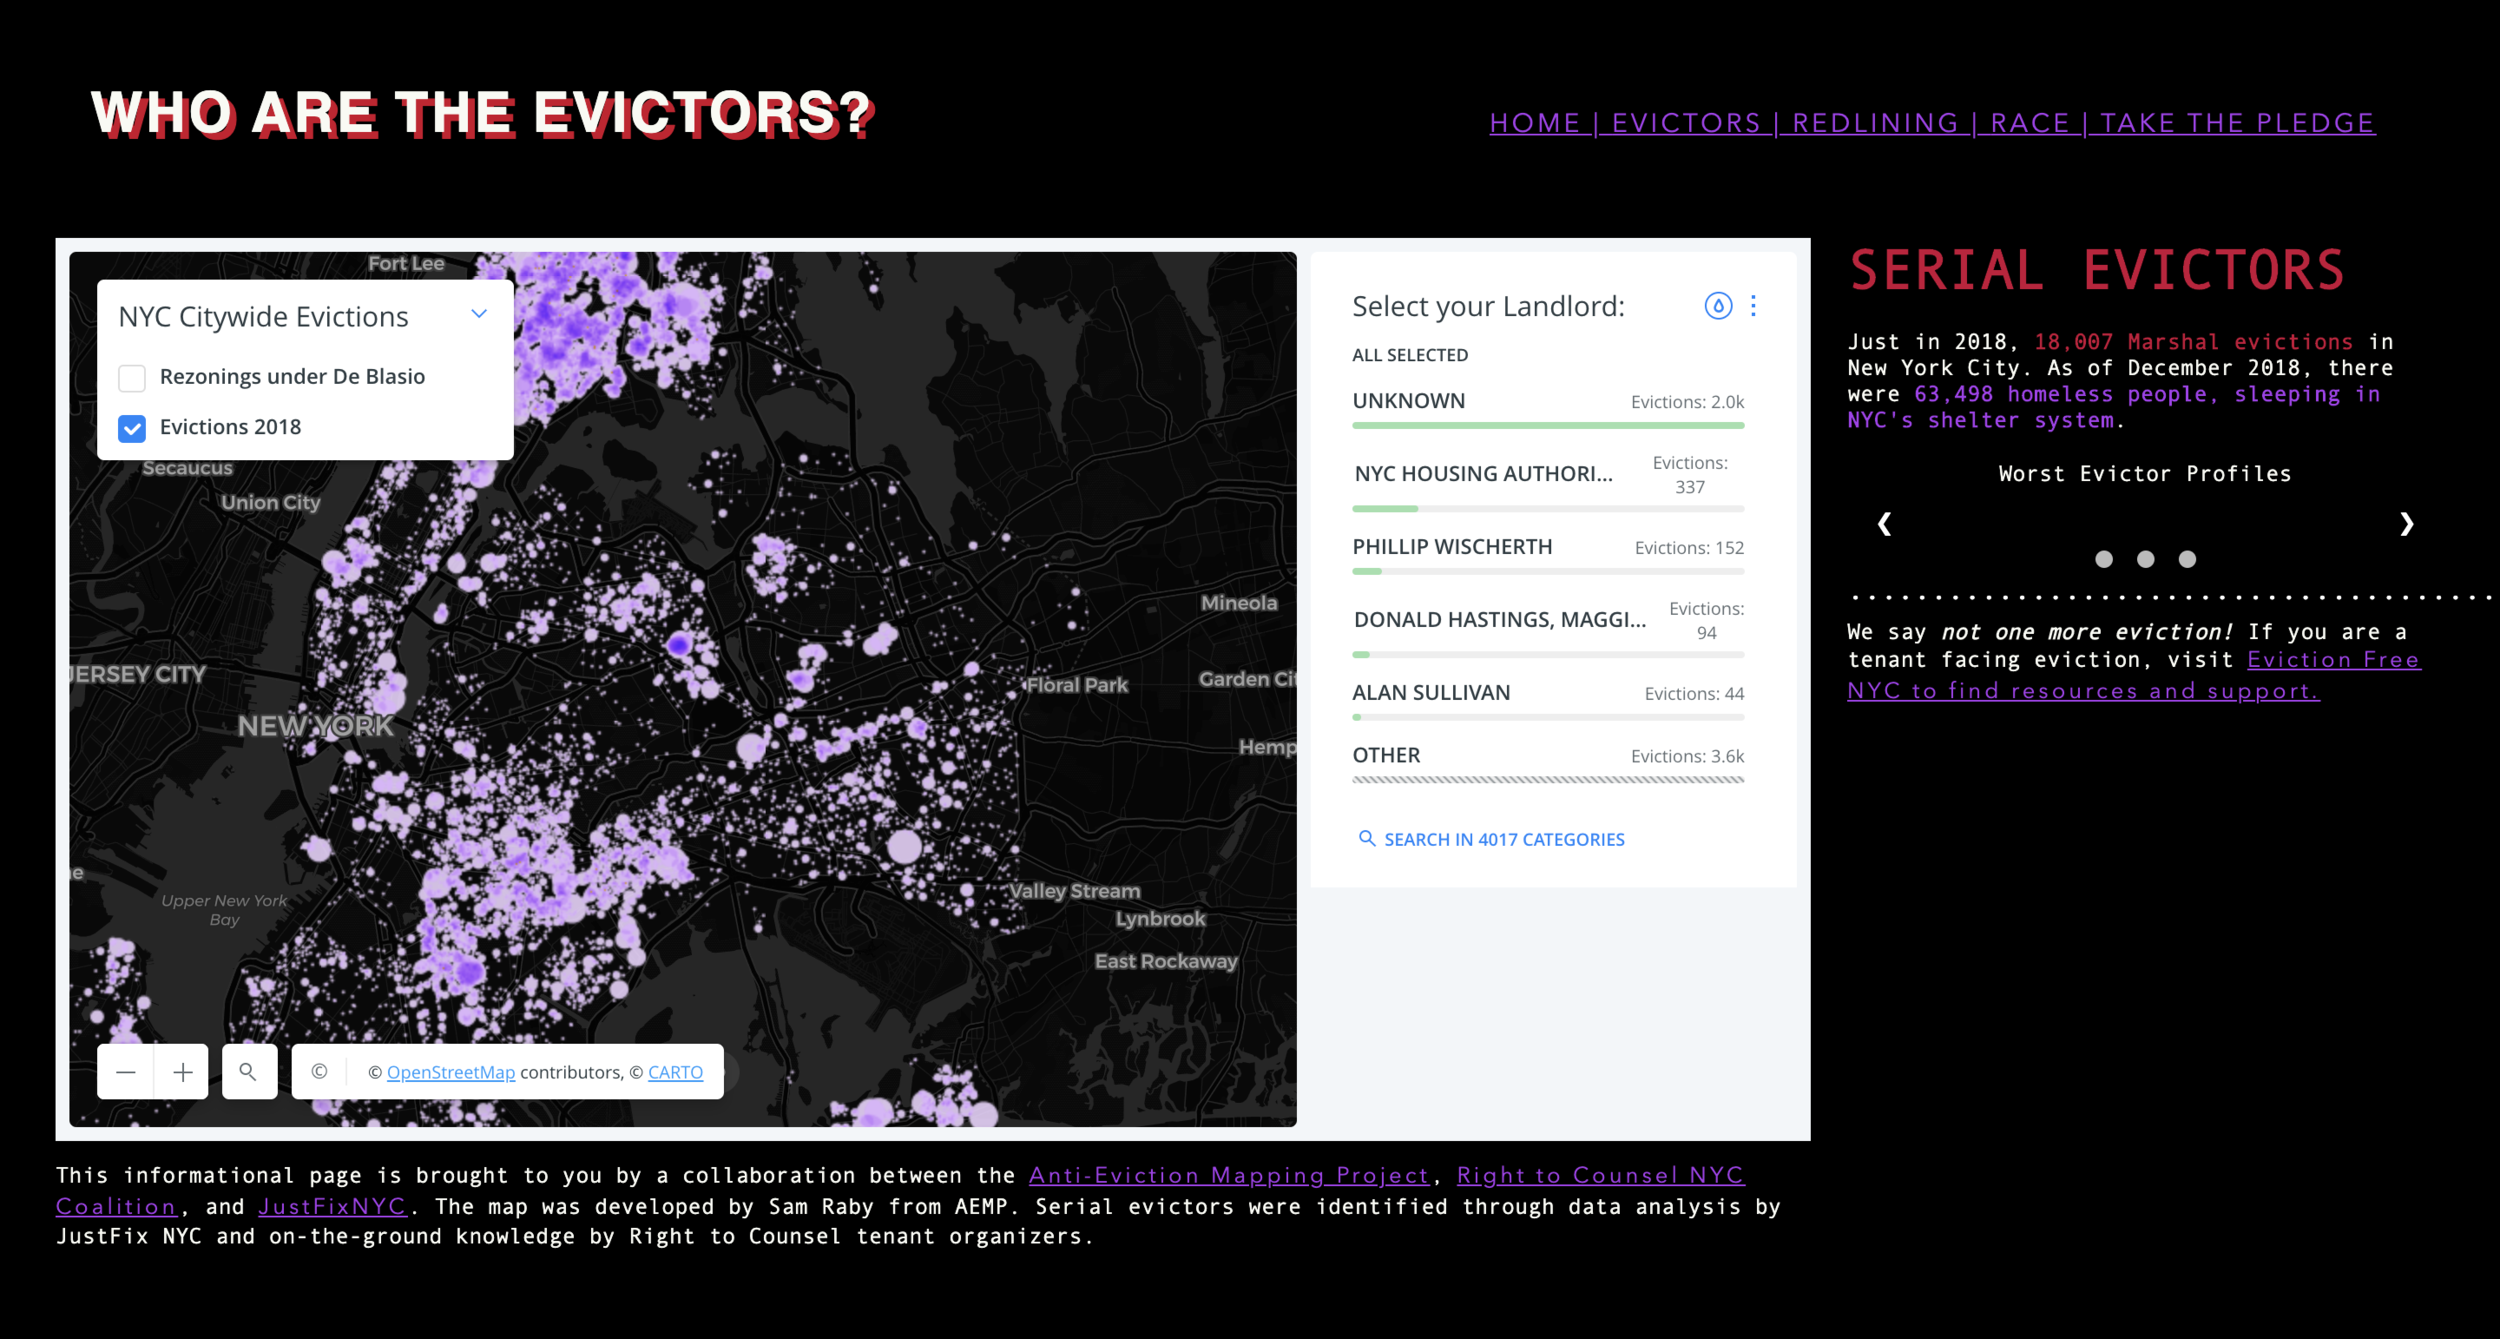
There were 18,007 residential evictions physically carried by marshals in New York City in 2018. Despite the sheer enormity of this number, our society tends to individualize responsibility, blaming tenants for falling behind on rent or for being exceptional “bad tenants” who don’t fit into the system. Yet, when you witness the scale of the eviction crisis in NYC, it becomes clear that eviction is not an individual problem, but the very way the housing system is designed to work.
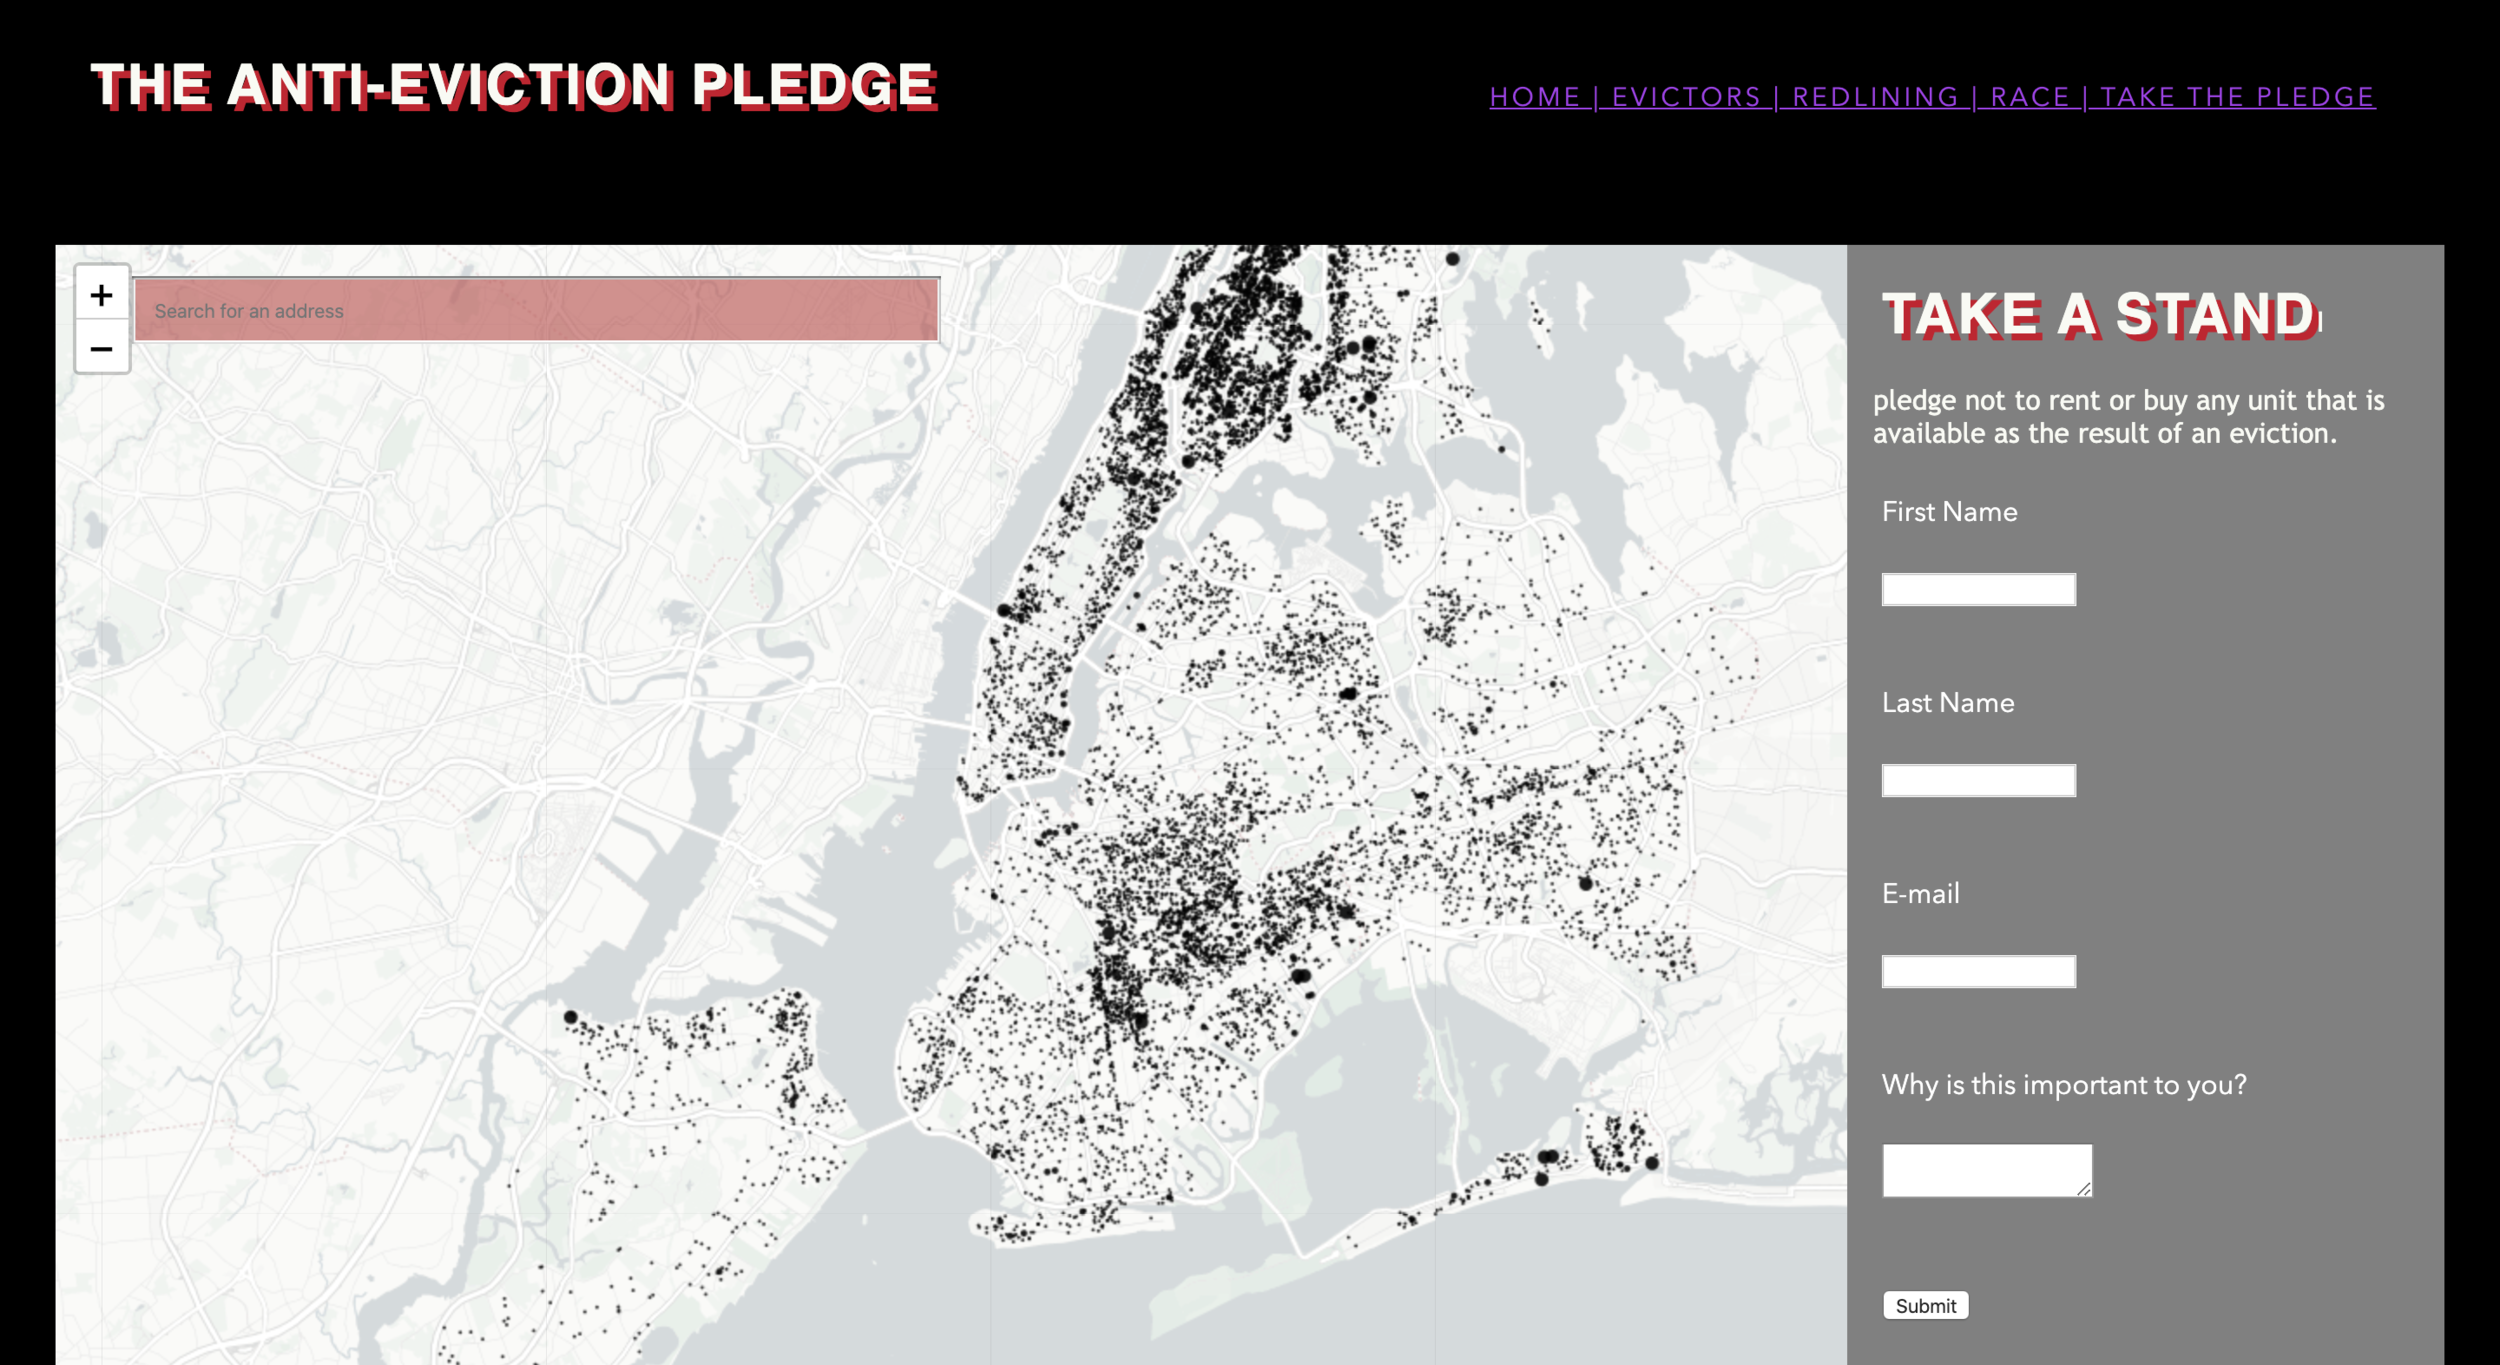
This project contextualizes New York City’s current eviction crisis through a historical lens, mapping longstanding discriminatory policies and how their afterlives continue to shape the urban landscape today. With a focus on shifting the blame of evictions away from individual tenants and towards structural processes and their profiteers, this atlas invites the viewer to explore the multidimensional facets of evictions and to take a stand for housing justice.
RACE, REDLINING, and EVICTIONS
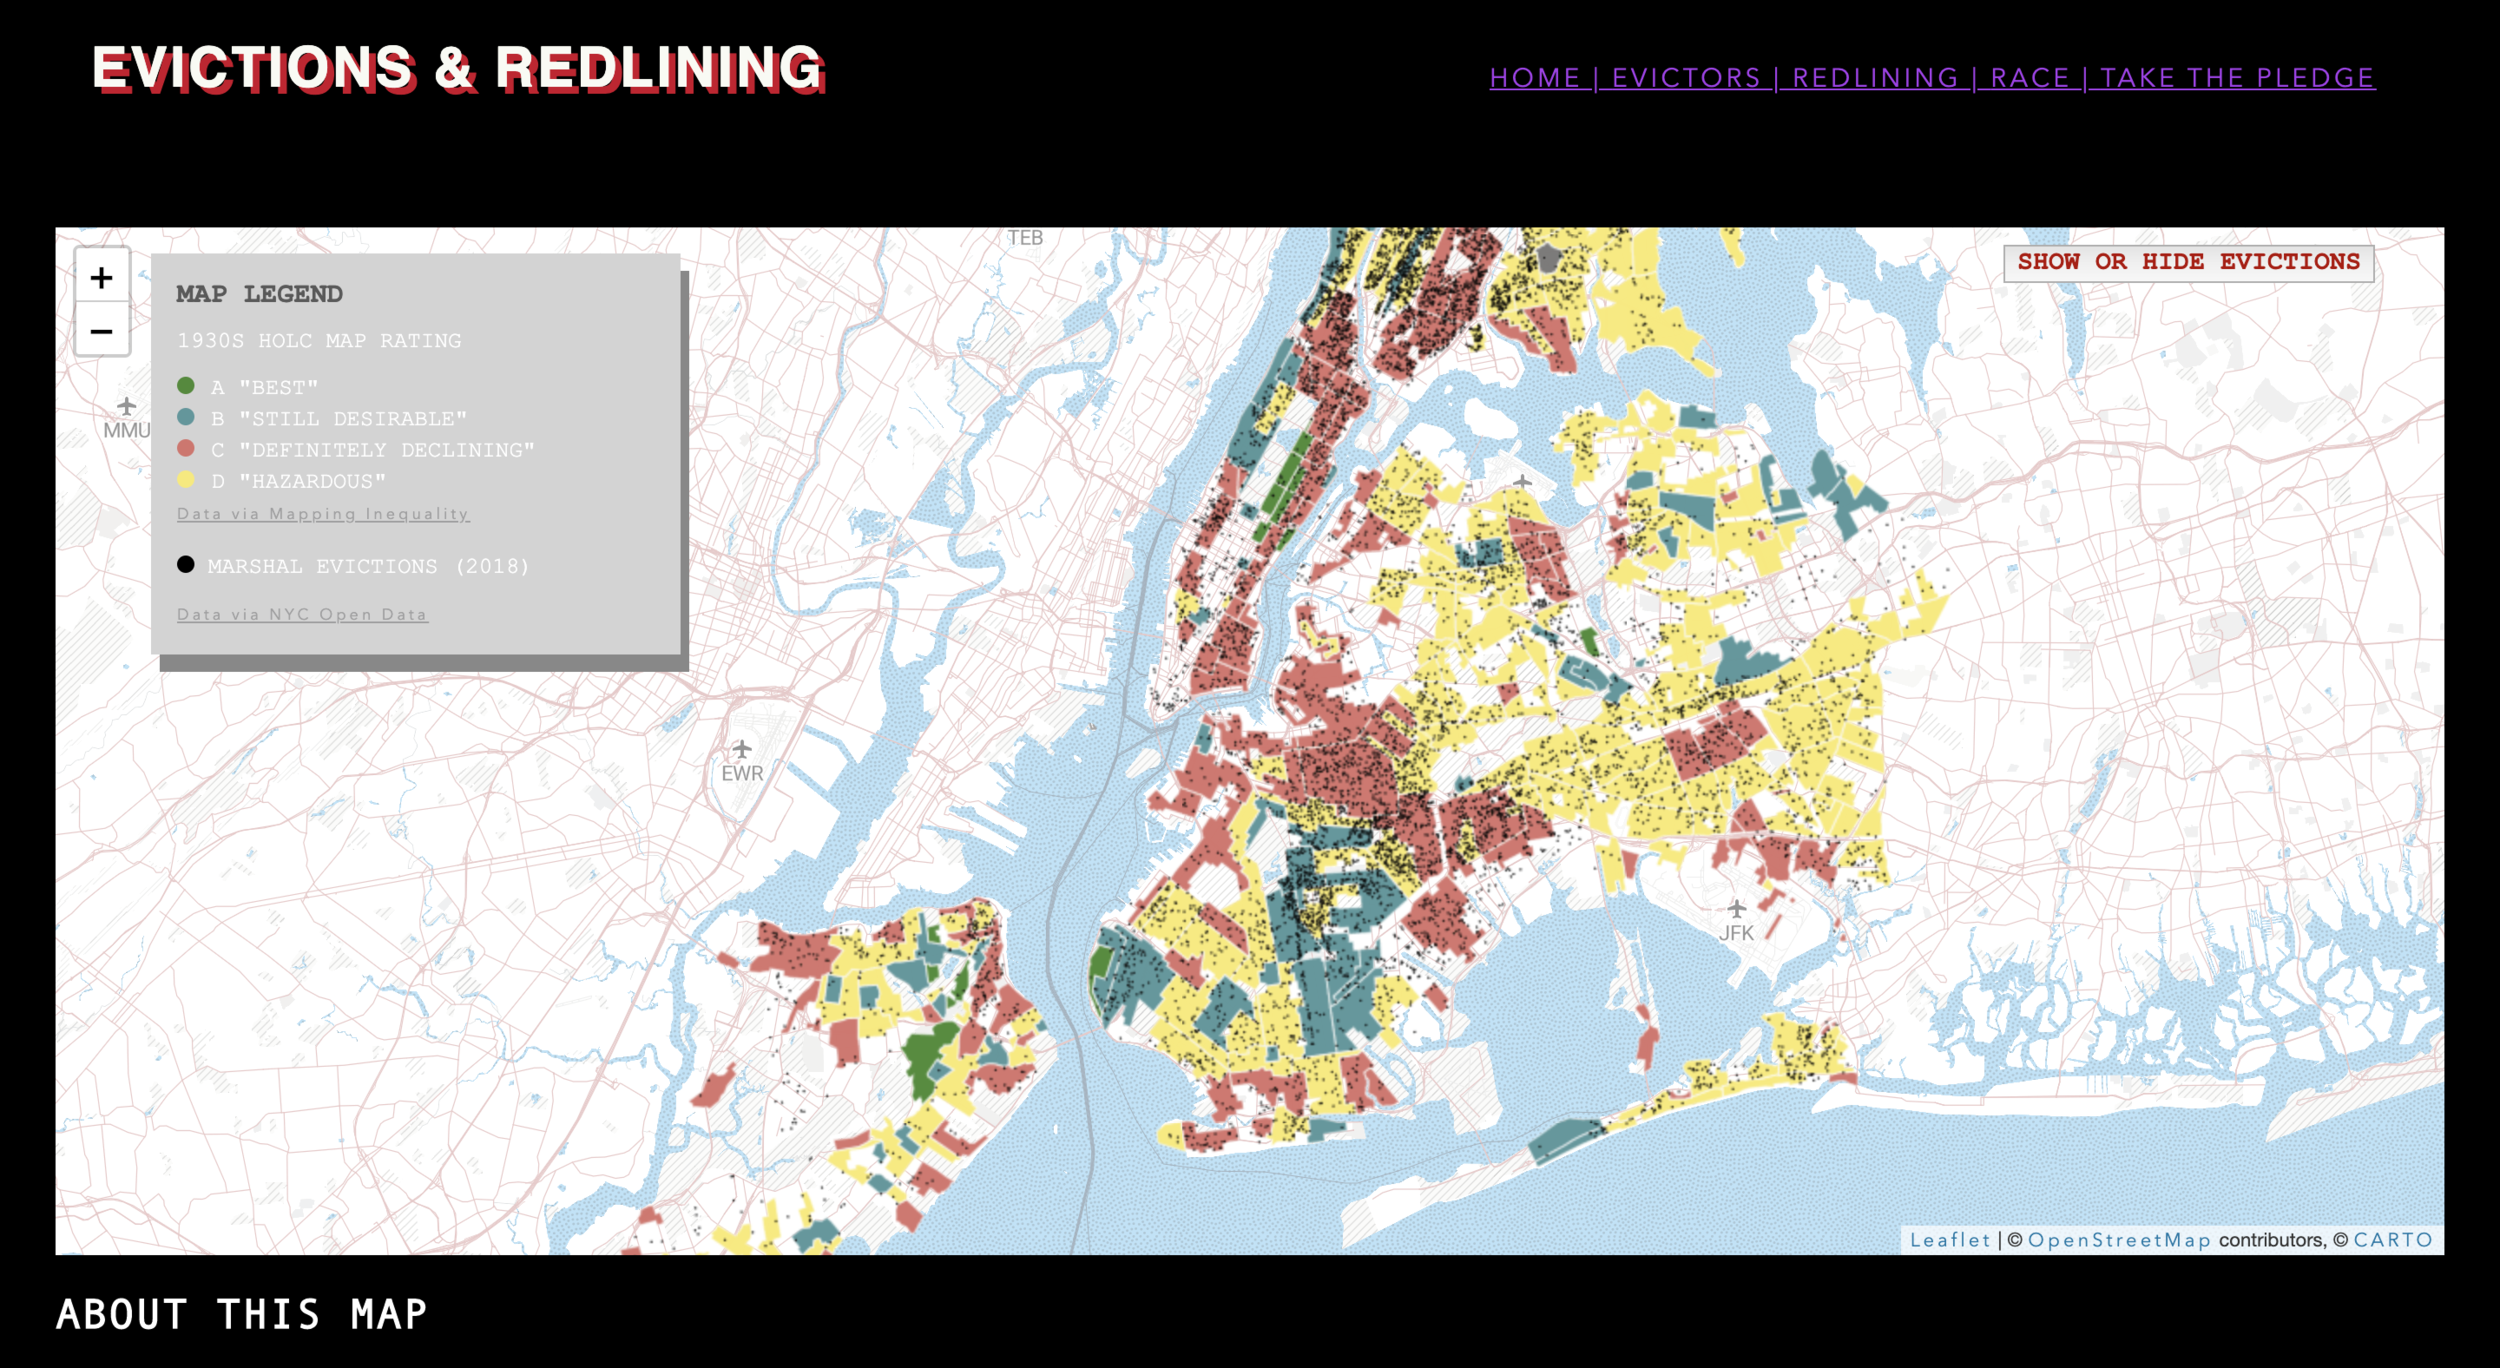
Evictions inscribe themselves in a long cycle of racialized disinvestment-reinvestment. In the 1930s, the federal government instituted a national policy of mortgage lending based on racial hierarchies. Maps of every major American city were drawn up to determine how "safe" each neighborhood was to receive loans from the Homeowner Loans Corporation (HOLC) based on a rating. Any neighborhood that had more than 5% Black residents was immediately "redlining," deemed to risky for mortgage lending. Based on these racist assumptions, POC neighborhoods across the US were systematically dinsvested, while white families were offered loans to flee urban centers and settle in affluent suburbs to pursue the American dream of homeownership.
"White flight" was facilitated by the federal urban renewal program in the postwar context, which tore down neighborhoods deemed "blighted" or depressed to make way for highways that made commuting from suburbs to urban job centers much easier. Thousands of families, primarily in communities of color, were uprooted by urban renewal under the guidance of Robert Moses in NYC, destroying the urban fabric and social networks of these neighborhoods. After redlining barred entire neighborhoods out of the mortgage system and urban renewal tore them apart, many neighborhoods faced hardships.
Throughout the 1970s, the City of New York instituted a policy of "planned shrinkage," where neighborhoods deemed worthless saw their public services shut down. The "Decade of Fire" in the Bronx is the most infamous example of how the City facilitated the near-decimation of an entire borough.
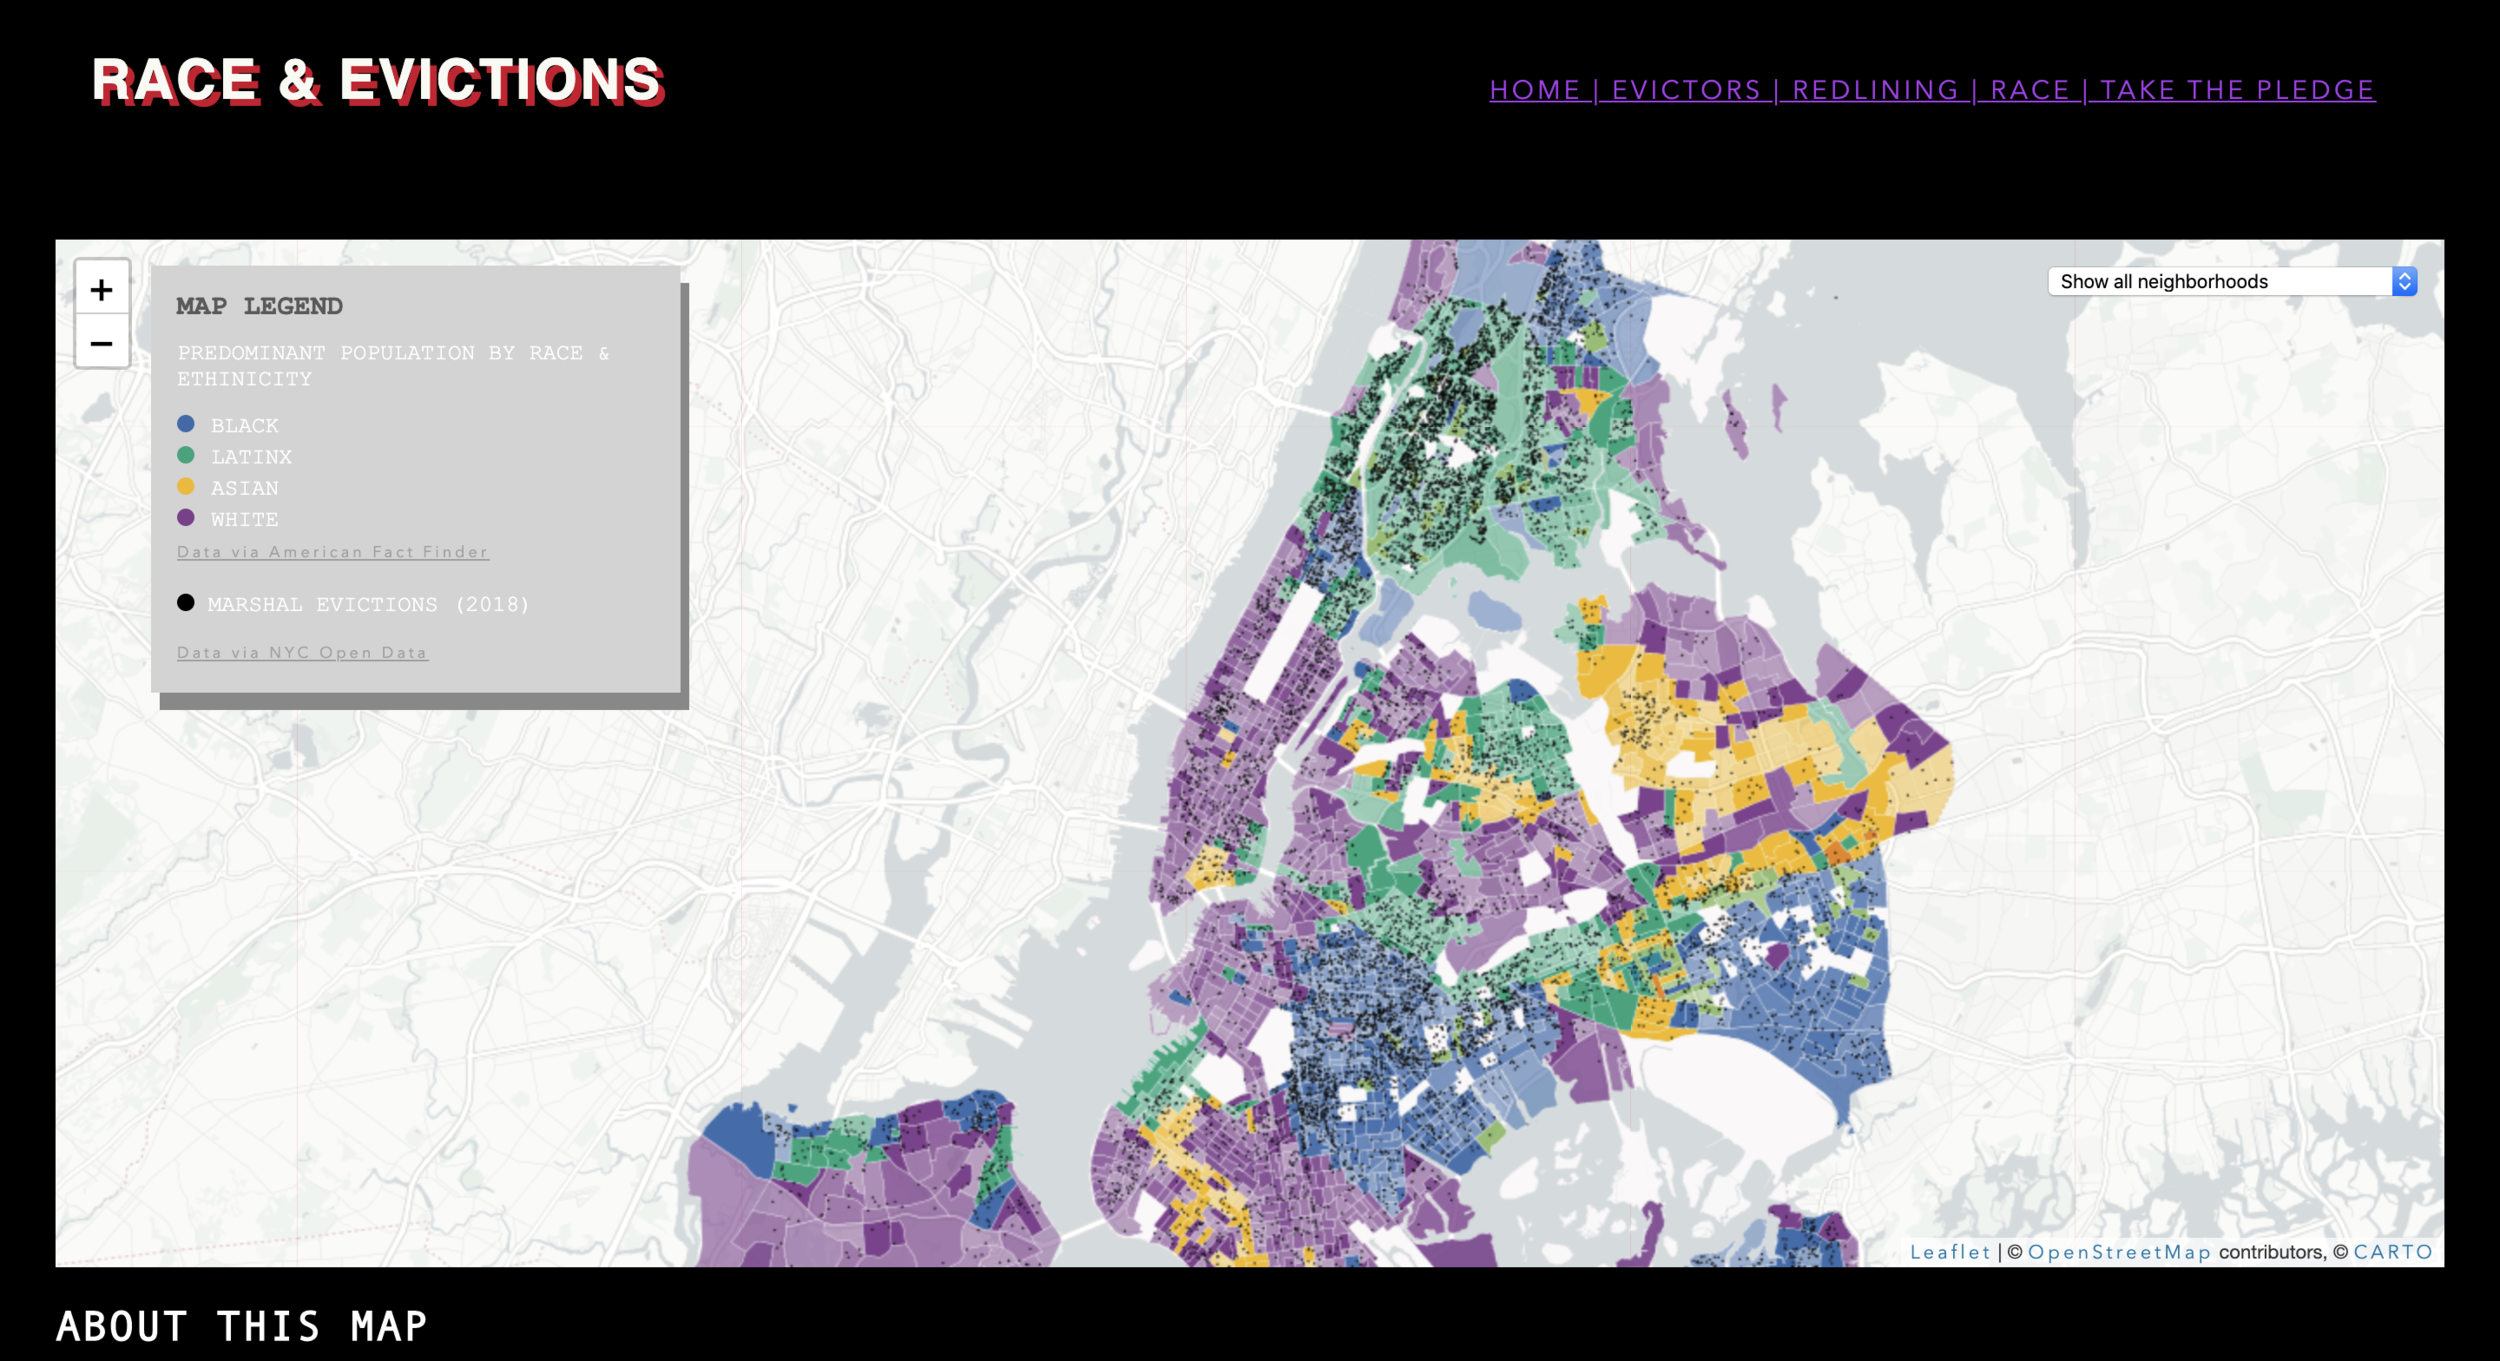
After decades of racialized disinvestment through redlining and urban renewal and hard-won battles by community organizations, communities of color across New York City are now at the frontier of gentrification. Far from being a coincidence, this neighborhoods present what critical geographer calls a "Rent Gap" - a profitable discrepancy between current property values and potential future values based on city policy. Real estate developers have their eyes on the prize. Through city policies such as rezonings, these neighborhoods are being revalued overnight, paving the way for predatory speculative development and a new wave of displacement. It is within this context of "racial capitalism," embodied by longstanding racialized urban planning policies that benefit the private sector while dispossessing the poor, that we must understand gentrification and displacement today.
We say not one more eviction! If you are a tenant facing eviction, visit Eviction Free NYC to find resources and support.
COLLABORATIVE PROCESS
I developed this Atlas as part of my final project for the Advanced GIS class at The New School in an effort to contribute to the Anti-Eviction Mapping Project, a data visualization and storytelling collective documenting displacement and dispossession in gentrifying landscapes, and to the Right to Counsel Coalition’s NYC Worst Evictors’ platform. I originally got involved with AEMP in San Francisco back in 2014, and helped co-found the New York City chapter in 2017. While I create this Atlas as part of a class assignment, I want to emphasize that all of these maps were made possible by the collective labor of many. Here are a few acknowledgements I want to make for this Atlas:
Data for this projects comes from both city data and on-the-ground knowledge from tenants organizers of the Right To Counsel Coalition.
The NYC Marshals Evictions dataset was deduplicated and cleaned row-by-row by members of the Housing Data Coalition and the Anti-Eviction Mapping Project.
Sam Raby from the Anti-Eviction Mapping Project developed the original NYC Evictions Map, which I then re-styled and added information to for the Redlining Map, the Race & Evictions Map, and the Pledge Map. Many members of the AEMP community were involved in workshopping the Evictions Map over 2017-2018, offering invaluable feedback and insights for improving the map.
JustFixNYC developed the profiles of Worst Evictors in collaboration with the Right to Counsel coalition, which I added as a sidebar to our Evictions Map, to connect the systemic nature of the evictions crisis to specific landlords we hope to hold accountable.
JustFix, the Anti-Eviction Mapping Project, and the Right to Counsel Coalition released a joint website on Monday, May 6, 2019 to put the worst evictors on blast and build power for the housing movement. You can view the Worst Evictors website here!